We use very little water at our homes. At least compared to how much is used elsewhere. Nationwide, the amount of water consumed in our homes is only about 10% of the greater whole.
If you have been paying attention to recent news you have likely heard about the California drought. This story is not new. Growing up in Arizona I was constantly bombarded with dire warnings regarding how California is running out of water because of all the people moving there. Well enough is enough. I can only hear about desert landscaping and composting toilets for so long. The data is free for the asking from the U.S. Geological Survey (USGS). So let’s take a look.
How much water do Californians use in their desert homes? Consistent with the national average it is a whopping 10.5% of total state water use. So, if The Golden State could halve the showering, lawn watering and pool parties it would barely assist in drought relief.
Typically, it is good practice to avoid pie charts. However, every once in a while, I will make an exception to show a disproportionate contribution to a whole. Here is what California residential water use looks like compared against everything else.
California Residential Water Use
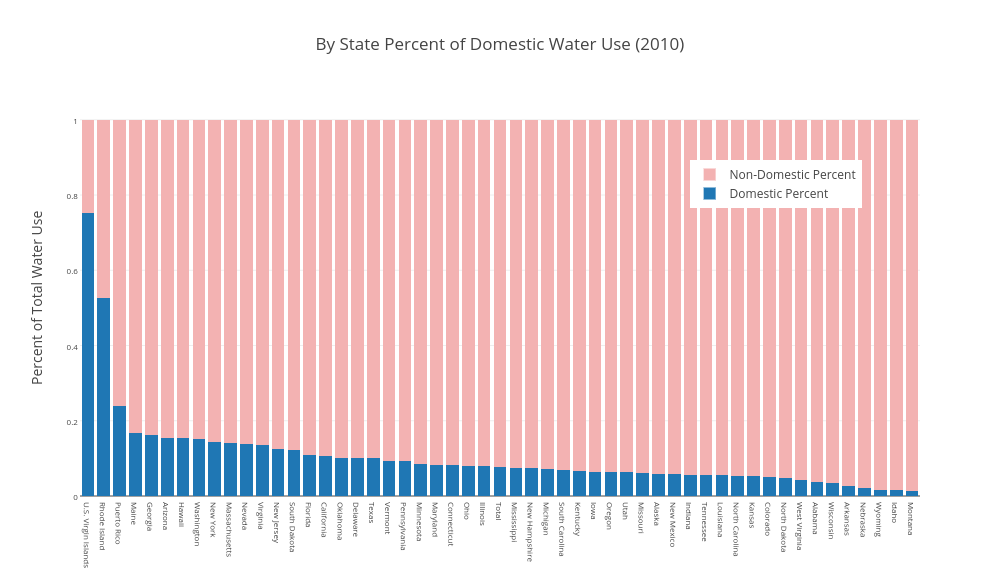
California is average with regard to domestic water use across the US. The chart below shows how little most states water use is a product of home consumption.
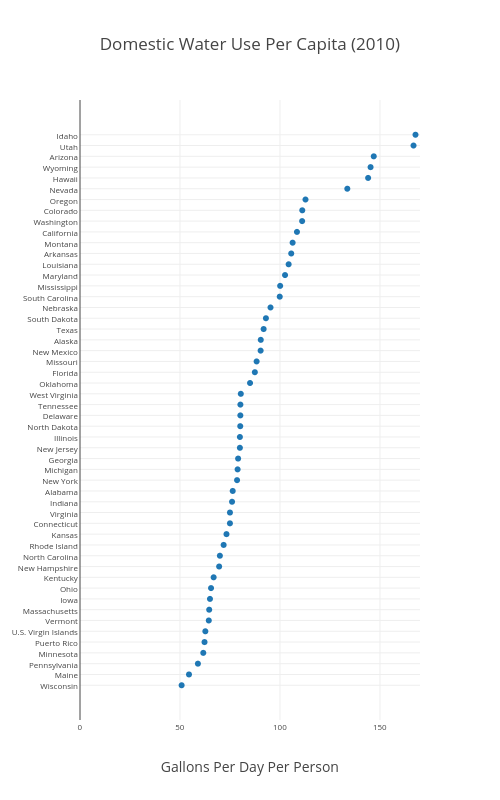
The per capita use in California is above the national average but lower than every other state west of the rocky mountains (see chart below).
The reason that domestic water use in California is so low is that the state uses the majority of their water in other ways (obviously). What are the other areas that demand water? Here are eight categories of water use tracked by the USGS. They are described in detail on their website here.
Thermo Electric Power: Use of steam-driven turbine generators
Mining: Extraction of minerals
Self-Supplied Industrial: Business use provided by self (i.e. well water)
Self-Supplied Domestic Use: Indoor and outdoor use at residences provided by self (i.e. well water)
Aqua Culture: Associated with raising organisms that live in water
Livestock: watering, feedlots, dairy operations and other on-ranch needs
Irrigation: Applied to sustain plant growth
Public Supply: Supplied by the public for domestic, industrial and general public purposes
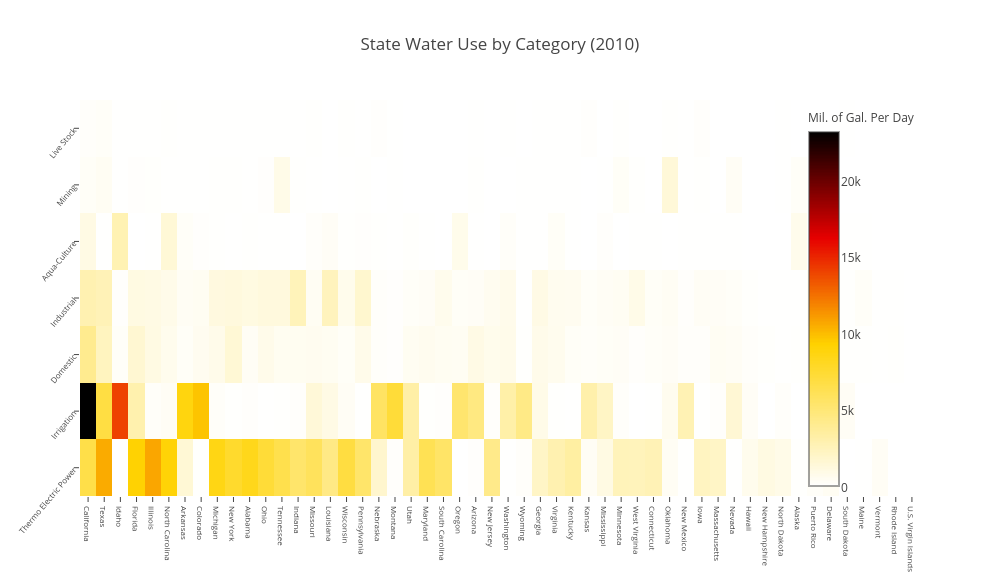
The heat map below shows how much water is used by state in these categories (in 2010 the most recent year available). I have consolidated public supply use into domestic and industrial. The states and categories are sorted on total use. For example California uses more water than any other state, however, thermo electrical generation is the largest user of all categories.
Here is the same data but as a total by state.
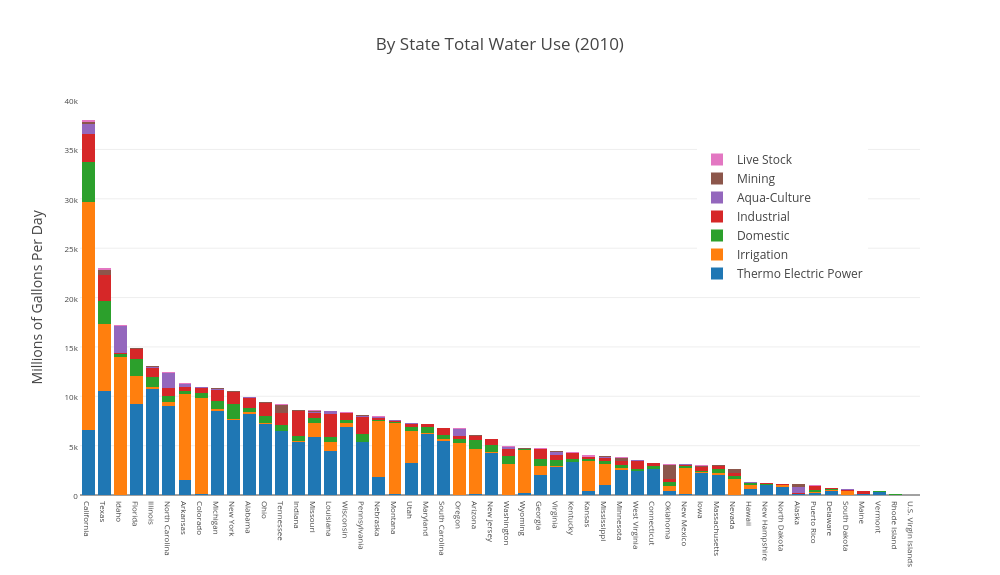
California’s water problem is primarily the result of one factor, irrigating desert farmland. The primary question is; why is no one willing to point out this obvious fact? Droughts are a certainty if you are heavily farming in an area that requires having to make your own rain.
Water will continue to be a hot debate topic in the years to come. However, if we focus on the wrong areas, and are not honest about how we can best inform decisions, we will miss the largest impacts. Now, feel free to go take a long shower.
As always my code and data can be found here: https://github.com/isaacfab/water