The coalition of same sex marriage supporters is much more diverse than the narrative you have been told. Instead of focusing on the negative view, of who opposes the practice, a healthy alternative is to explore those that support it. In the past decade, the nation experienced a drastic transformation in views on same sex marriage. The chart below shows a consolidation of polling data from the this time period.

I could not find this consolidated polling data in a machine-readable format so I created it from web scraping here. Though it is not comprehensive you are welcome to it. Please see the github link below for the data.
Over a relatively short period of time the attitude towards gay marriage flipped. Put another way; approval of the practice crossed the threshold into a majority popular opinion. Only a few short years ago every presidential candidate had to denounce (at least from the two main parties) the practice. Now politicians have to explain why they never supported it in the first place. The following chart shows how average opinions changed from 2003 to 2013 in various subcultures (source).

The popular political narrative goes something like this; republicans are homophobic and democrats are tolerant. The popular religious narrative is that Christians (in particular, evangelicals) are homophobic and the unreligious are tolerant. Both of these narratives have merit from an 'averages' point of view but both strip away credit from many supporters. An important consideration is that even though a large category of the population does not support the practice on average. The minority of that category (like evangelicals and republicans) may, in fact, be a significant portion of supporters. Like most hot debate topics, the popular narrative covers the truth of reality.
Now that just over half of Americans support gay marriage, a fair question is; what does that portion of the population look like? This question is critically important because only by a slim margin does gay marriage enjoy majority support. Allowing the popular narrative to influence whom the public perceives to be in the coalition of supporters can be very misleading.
The following charts show a religious, racial and political breakdown of portions of supporters between 2003 and 2013. I used census population data, pew/gallop polls, the information from the Public Religion Research Institute (PRRI) survey (referenced above) and some Bayesian analysis to produce the figures.
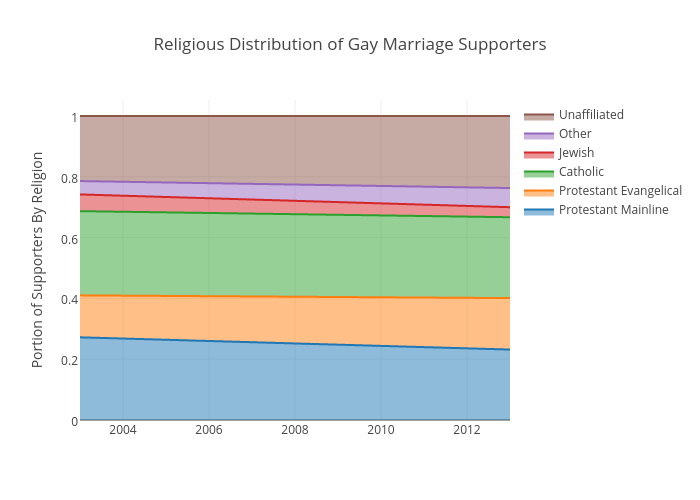
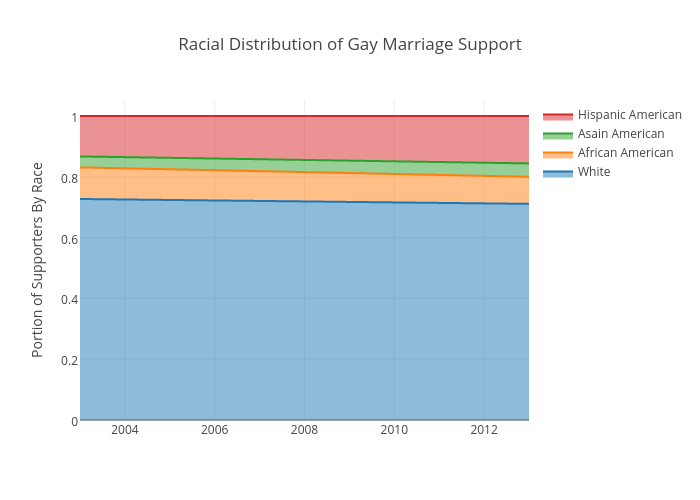
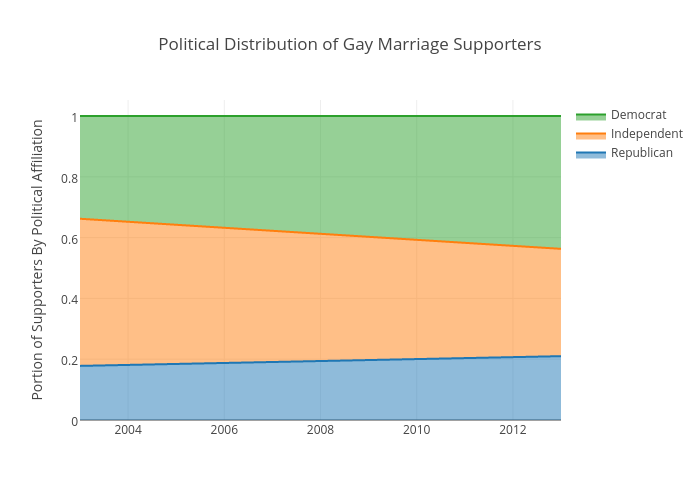
An important observation is that supporters are more likely to be democrats over republican by a 2 to 1 margin. However, without the republican support gay marriage favorability would still be a minority opinion. The same argument can be applied to Christian evangelicals. On the other side of the coin, large portions of democrats fall in the un-support category. These individuals are primarily from the minority communities, a fact rarely mentioned in mainstream media.
In all, the coalition of gay marriage support is quite an interesting group. ~1 in 5 is a republican or evangelical, about 7 out of 10 are some form of Christian and racially speaking they are mostly white. It seems the path to national majority support was accomplished with help from some unappreciated sources.
As always my code and data can be found here: https://github.com/isaacfab/gay_marriage